After lines, conic sections (circles, parabolas, etc.), and graphs of trigonometric functions, the most familiar curve has to be the bell curve. Perhaps it is even more famous than some or all of those other curves, especially amongst students who just finished an exam that they don't feel good about.
Explaining exactly why we use the bell curve takes some work, but a rough explanation can be given in terms of coin flips. If you flip a coin say 20 times, then you can expect to get 20 heads with a certain probability, 19 heads and 1 tail with a certain probability, 18 heads and 2 tails with a certain probability, and so on. This is an example of a binomial distribution. If you plot these percentages, you get a shape that looks roughly like the bell curve. For 30 coin flips, the shape looks even more like the bell curve.
In fact, you can make the shape looks as close to the bell curve as you want by considering a large enough number of coin flips. The coin doesn't even need to be fair. That is, it could favour one of heads or tails more than the other, and with enough coin flips, you could still make the shape look as much like the bell curve as you like.
So lurking behind many things that give a shape that looks like the bell curve, there is a process something like a coin flip going on. This is an oversimplification, of course. There are other ways to reach the bell curve besides coin flips. The whole story would take a while to explain, however. The point is that we can arrive at the bell curve through a simple, familiar process.
The most famous bell curve is not the only bell curve, though. The one I'm talking about above is known as the Normal Curve or Gaussian Curve [1], but there are other curves besides these that have a bell shape, but aren't Normal Curves.
One curve comes from the logistic distribution. Another curve comes from the Cauchy distribution. What I wonder about these curves is this. Is there is some way to arrive at either of these distributions from some simple process in the same way that we can arrive at the normal distribution through the process of coin flips?
One place where the logistic distribution crops up is in the ELO rating system. This system was developed by a physicist named Arpad Elo (for some reason, his name gets capitalized, as if it's an acronym, when it comes to the rating system) to rate chess players, though it can be used for any type of competition, from individual games like chess to team sports, like soccer. Each competitor has a rating, and the probability that one competitor will beat another can be calculated from their ratings. The calculation depends a probability distribution. In the original scheme, a normal distribution was used, but it was discovered that a logistic distribution gave more accurate predictions.
In fact, it was this application of the logistic distribution that led me to my question above. The empirical evidence suggests that it's the better choice, but I want to know if there is a reason why. Is there some sort of logistic equivalent to coin flipping for the normal distribution that explains why predictions are better with the logistic distribution?
Logistic curves also pop up in some population growth models. There are continuous and discrete versions of these models, which in a sense parallel the normal curve (continuous) and the coin flips (discrete). Perhaps the answer to my question lies here, but I can't see the connection between population growth and games. (Both do involve competition, I suppose, but it's not clear to me whether or not this is a meaningful connection, or just a linguistic coincidence.)
The Wikipedia article for the Cauchy distribution says that "it has the distribution of a random variable that is the ratio of two independent standard normal random variables." That suggests that ratios of two independent binomial random variables (coin flips, for example) could be an avenue to explore.
It's also not hard to create other bell curves. Take any function $f(x)$ that is positive, symmetric about some vertical axis, and concave up. Then $1/f(x)$ will give a bell curve. I expect that most of these aren't interesting, though. Are there any others, besides the 3 mentioned above, that are?
[1] It's actually a class of curves that are related to each other by stretching and shifting vertically and horizontally.
Tuesday, 25 February 2014
Sunday, 19 January 2014
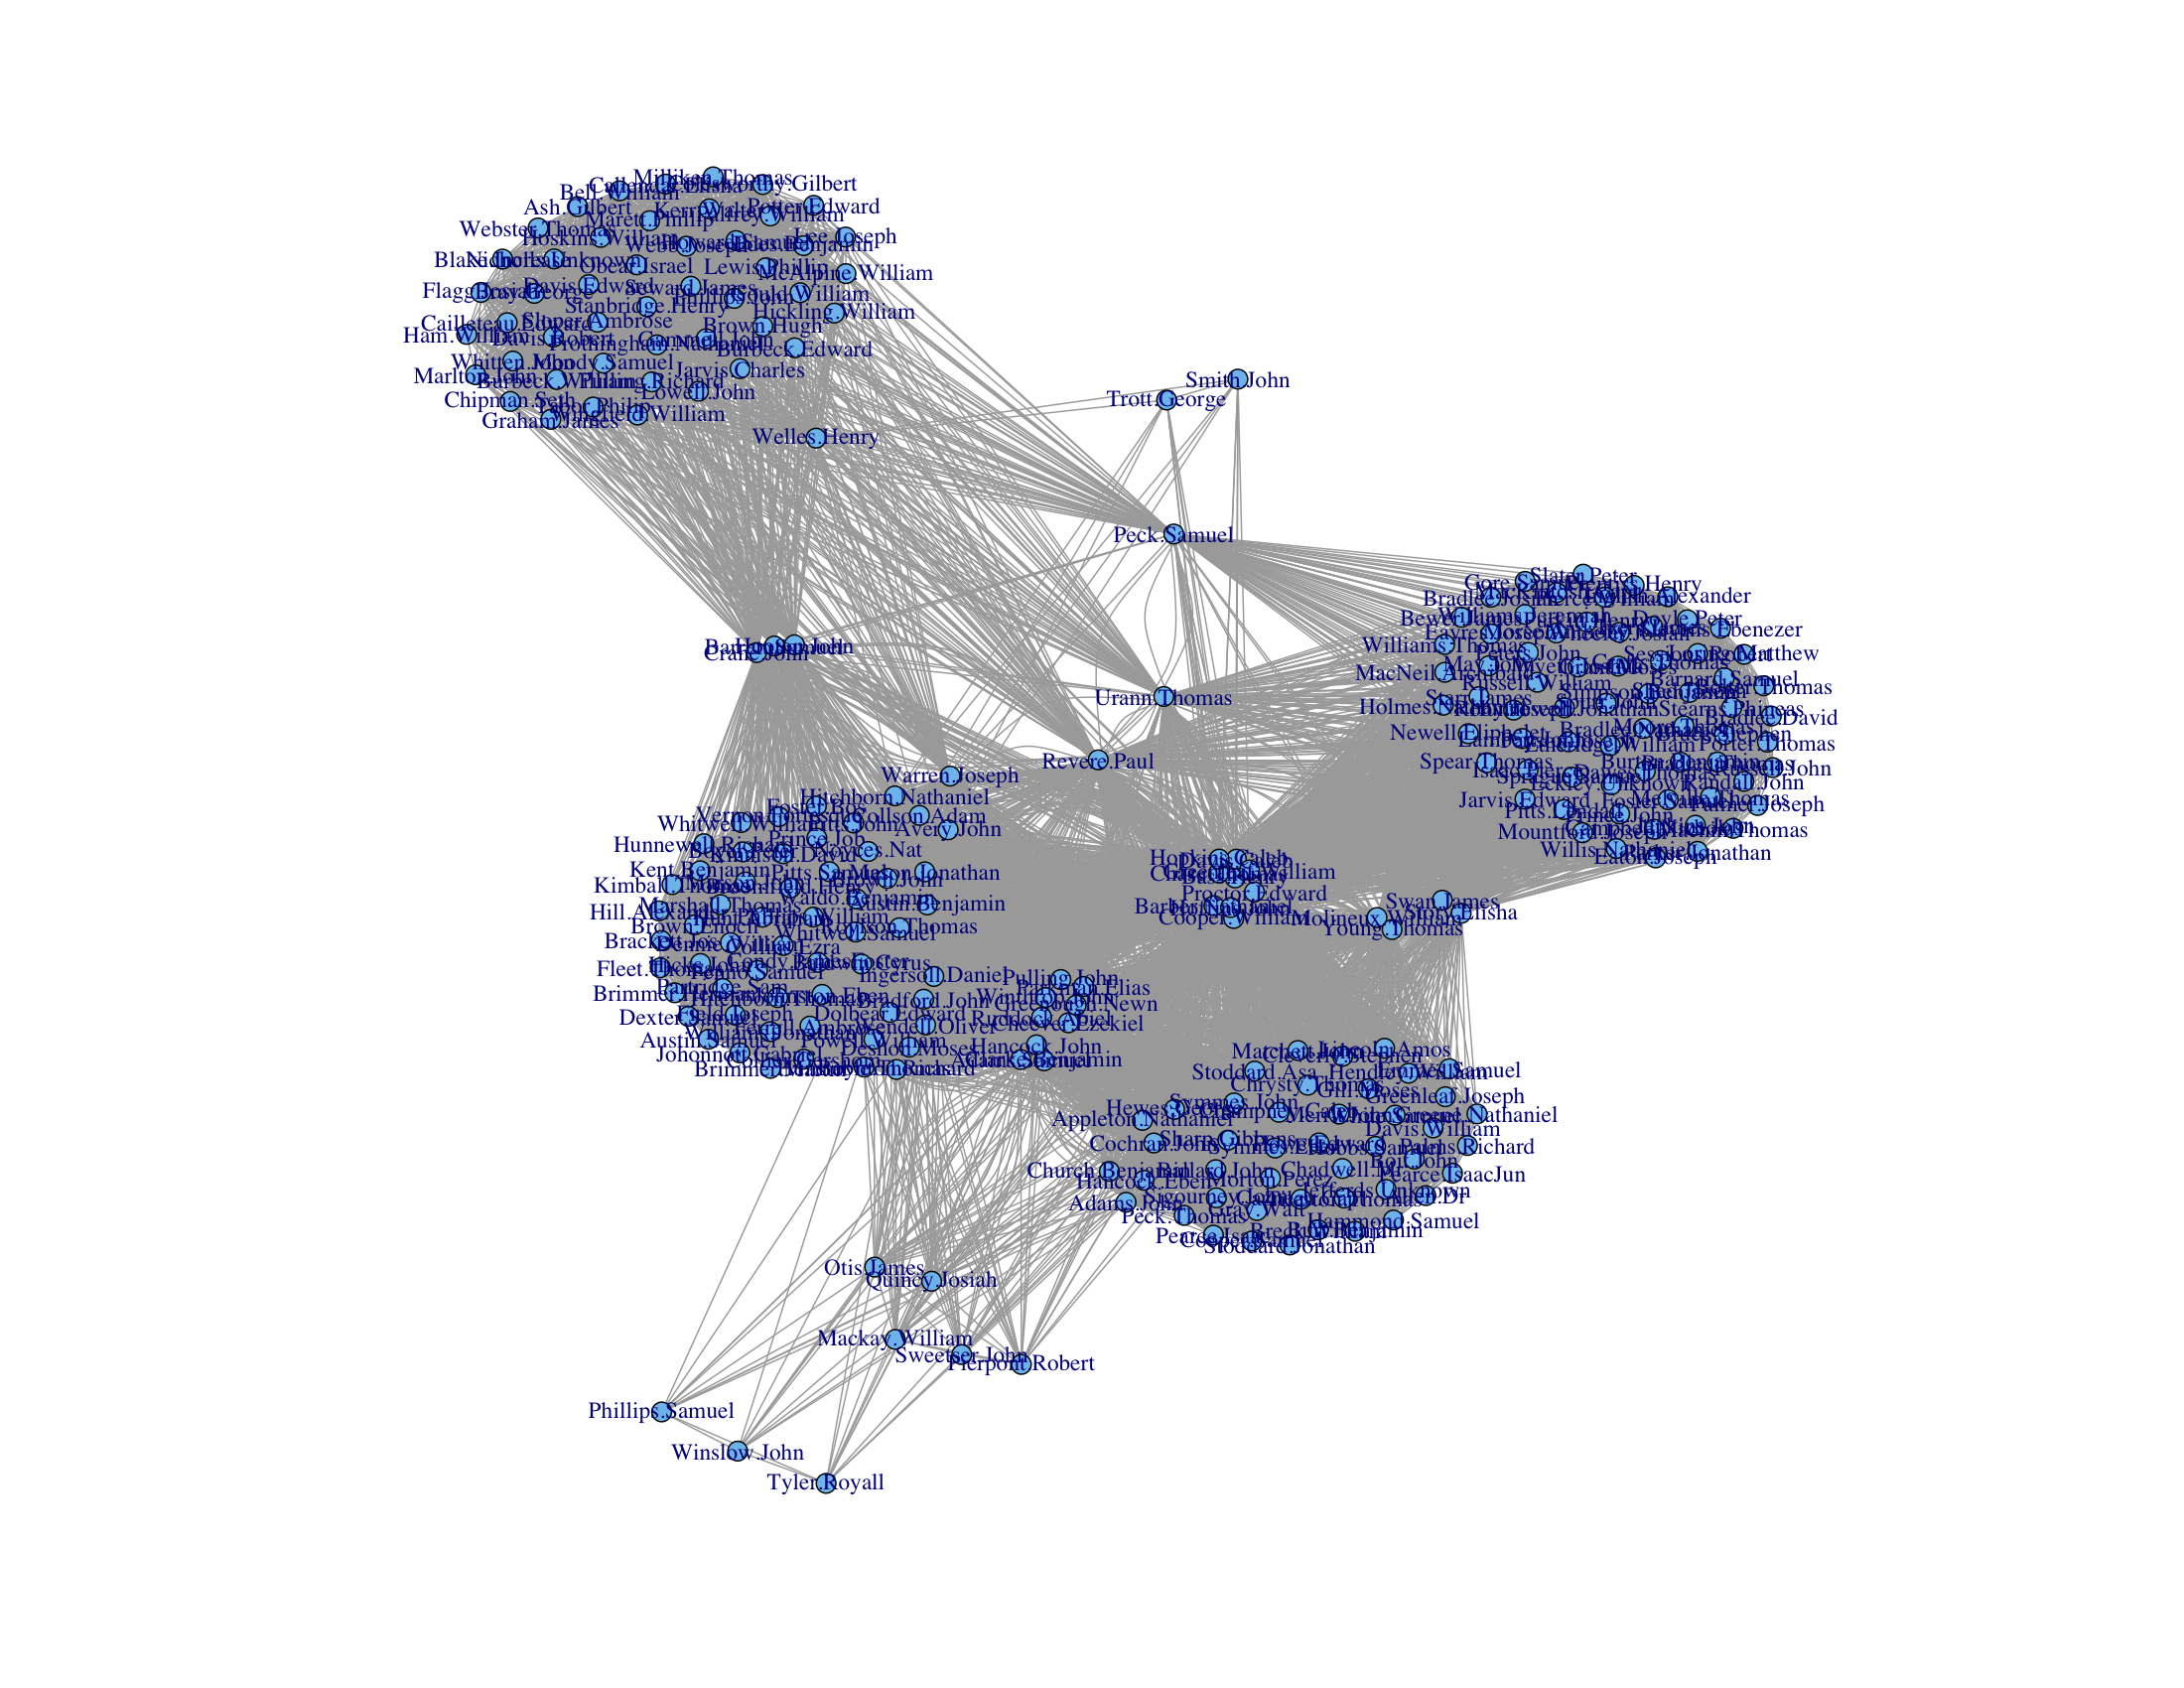
Paul Revere and Graph Theory
Constructing a graph based on historical data, Kieran Healy explains how we can use the graph to "find" Paul Revere.

I have been asked by my superiors to give a brief demonstration of the surprising effectiveness of even the simplest techniques of the new-fangled Social Networke Analysis in the pursuit of those who would seek to undermine the liberty enjoyed by His Majesty’s subjects. This is in connection with the discussion of the role of “metadata” in certain recent events and the assurances of various respectable parties that the government was merely “sifting through this so-called metadata” and that the “information acquired does not include the content of any communications”. I will show how we can use this “metadata” to find key persons involved in terrorist groups operating within the Colonies at the present time. I shall also endeavour to show how these methods work in what might be called a relational manner.
Saturday, 4 January 2014
When to set office hours
This past term, I was assisting as a tutor for one section of a math
course (I am teaching this course in the present term). The students in
the class wanted to have some extra tutorial time. One of the students
collected information about when everyone was available. It turned out
that there was no common period where all interested students could
come, so there ended up being no extra tutorial.
This was between the professor and the students. I didn't find out about it until after the fact. I assume from the conversation, though, that there was going to be at most one extra tutorial, because the proposal was nixed once it was revealed that there was no common period.
But suppose that the professor was willing to offer a number of tutorials limited only by what periods where either he or I would have been available to lead one (assuming that the tutorials would be held during the day). Then it may still be possible to find a way to accommodate everyone. In fact, it's pretty easy to tell whether or not it is.
We already have a list of which periods students are available. Since at least one of the available tutors (in this case, me and the professor) must be at the tutorial, we can strike from that list all periods where none are available. If everyone is available in at least one of the remaining periods, then all students can be accommodated. Otherwise it's not.
One way to do this is simply hold tutorials in each of those remaining periods. However, professors have many responsibilities besides teaching ("publish or perish" and all that), so it's desirable to use the fewest tutorial periods possible. So how can we do that?
It turns out that this is an application of a well studied problem in combinatorics, known as the set cover problem. Suppose we are given a collection of sets, say $S_1,S_2,\ldots, S_k$. Let $U=\cup_{i=1}^k S_i.$ Suppose that $I$ is a subset of $\{1,2,\ldots,k\}$ and $U=\cup_{i\in I}S_i$. Then $I$ is called a {\em set cover} of $U$. The set cover problem is to minimize the size of $I$.
Now, suppose that the periods are numbered $1,2,\ldots, k$. For each $i$, let $S_i$ be the set of students who are available during period $i$. Then the we can find the fewest tutorial periods needed by finding the smallest set cover of $U$.
Unfortunately, the set cover problem is NP-complete. The formal definition of what this means takes a fair bit of work to explain, so I won't get into it here (if you're interested, follow the link to the topic in the Wikipedia article on the set cover problem). In practical terms, though, it means that there is no currently known way to find the smallest set cover efficiently (and there probably won't ever be). Perhaps the number of students and number of periods is small enough that it is still manageable by computer, or there is some approximation algorithm that will give a near-optimal solution.
Monday, 30 December 2013
Google "WordRank"
One of the more interesting things I learned about while I was a graduate student was Google's PageRank algorithm (to this day, it remains one of my go-to applications when I want to illustrate the real-life utility of certain concepts in linear algebra classes, although as each year passes, the likelihood that a student can remember life before Google gets smaller). What made it particularly interesting to me is that it could be stated largely in the terminology of algebraic graph theory, my own field of research. I had seen similar ideas before, but I had never seen anything like it put into practice (well, I had seen Google, but I wasn't aware that it was putting these ideas into practice).
The basic idea behind Google's algorithm is that good websites are websites that are linked to by good websites. If you think that sounds awkwardly circular, you wouldn't be wrong. Nevertheless, there's an elegantly simple way to express the idea as a matrix equation, and solutions to this equations are well studied. Things don't always work out as well in practice as they do in the abstract, but Google's search engine was better than any search engines that came before it. In this case, the abstract and practice lined up quite well. In fact, the only one of these older search engines that's still around to this day in any noticeable way is Yahoo, but it has a much smaller share of the search engine market than Google does.
Now, one of my side interests is languages (or linguistics maybe, but I'm not sure how much my forays take me into actual linguistics. Favourite websites/blogs by people who know what they're talking about include Dialect Blog and Language Log). While pursuing this interest, one of the things I've come across is lists of the most common words in a given language. I wonder if something like Google's PageRank algorithm could be used to give an alternate word ranking words. Instead of using links, you could say, in the same awkwardly circular fashion, that important words are words that are used with important words, set it up algebraically, then find the solution. The result would assign a "WordRank" to each word.
What "used with" means is not well defined, mind you. We could say that a word $A$ is used with a word $B$ if $A$ and $B$ are used in the same sentence, or perhaps used within a certain number of words of each other, regardless of whether or not they reside in the same sentence. Maybe there is some other suitable choice.
While I could easily solve the algebra part, setting up the equation would take quite some work, and it might be beyond my abilities. For example, if I chose to say words are used together when they are in the same sentence, I would need to decide whether or not a period in a given text is meant to indicate an abbreviation or the end of a sentence. It's easy enough to do if I'm reading, but I would need to program a computer to do this for the a sufficiently large quantity of text. That strikes me as a nontrivial task.
That wouldn't be a problem if I chose to say that words are used together when they appear within a certain number of words of each other. Suppose this number is $n$. The question arises as to what $n$ should be. The answer is not obvious to me.
Another complication is that spelling alone is not enough to determine what word is being used. For one thing, words can have different forms. Nouns can be plural or singular, verbs can be present tense or past tense, etc, and spellings change as a result. Also, different words can have the same spelling. There might be other issues (how to compensate for typos, maybe). It would take some effort to sort these out, and I wouldn't know where to start. These complications would crop up in producing lists based purely on frequency, though, and these lists already exist. So I would assume somebody already knows how to deal with that.
Once these obstacles are overcome, we could make a matrix $M$. The rows and columns of $M$ are both indexed by words (so the matrix is square). If $v$ and $w$ are words, then $(v,w)$-entry of $M$ is the number of times $v$ appears with $w$ in some corpus. Since $v$ is used with $w$ if and only if $w$ is used with $v$, $M$ is also symmetric. Following the example of the PageRank algorithm, we find an eigenvector ${\bf x}$ of $M$ corresponding to the largest eigenvalue of $M$. Provided that $M$ satisfies certain conditions, ${\bf x}$ will be unique up to a scalar multiple. Furthermore, we can assume that the entries of ${\bf x}$ are all non-negative. (These are consequences of the Perron-Frobenius Theorem). The vector ${\bf x}$ is called the principal eigenvector of $M$. The entries of ${\bf x}$ can be ranked according to their size, with one entry ranked higher than a second if the first entry is greater than the second. The WordRank of word $w$ is then the rank of entry $w$ of ${\bf x}$.
The total number of occurrences of the word $w$ is the row (or column) sum of row $w$ of $M$, which is given by $M{\bf j}$ where ${\bf j}$ is the all-ones vector. Suppose that $D$ is the diagonal matrix where diagonal entry $w$ is the number of occurrences of word $w$. Then column sums of $MD$ are all 1. Since $M$ and $D$ are both nonnegative, $MD$ is as well. Thus, $MD$ is a stochastic matrix, and therefore, the principal eigenvalue is 1. As an alternative to the scheme derived in the previous paragraph, we could use the principal eigenvector of $MD$ instead of $M$ to determine a ranking. The PageRank algorithm is based on the website analogue of this matrix.
In devising the PageRank algorithm, the Google founders found it necessary to modify this matrix further. Perhaps some other modifications to $M$ or $MD$ would be necessary here.
One reason I think this could be interesting is that it's not just based on how common a word is, but how much each word "works" with other words. The top $m$ words using WordRank could provide a more coherent list of words. Of course, a word will get used more if it works well with other words, so any algorithm worthy of the name WordRank could end up producing more or less the same thing as ranking by frequency.
This idea could also be nonsense. However, in the course of learning more about the PageRank algorithm, I came across another paper which generalized the algorithm. In the paper, they applied a variation of PageRank to the problem synonym extraction, with at least modest success. So using these ideas in the realm of languages does not seem particularly absurd.
In any case, I think it would be interesting to see the results.
Possibly there are other things that could be done with the matrices $M$, $MD$, or maybe some other related matrix. When designing language learning resources, it's important to come up with vocabulary lists. We could use frequency or WordRank, or some combination, to compose a these lists. But these lists probably need to be divided into smaller chunks for individual lessons. One would hope that these chunks consist of a coherent set of words, for example, words centred on a theme, like food related words, occupation related words, and so forth.
One could do this by hand, of course, and maybe that's the best way once you decide which words to use. But there are techniques based on eigenvalues and eigenvectors (for example, using the Fiedler vector) that are used to subdivide networks into smaller coherent components. Perhaps some variation of these techniques could be employed here.
Tuesday, 26 November 2013
A graph labelling problem
I've been doing some work using the shapefiles for the current Canadian federal electoral districts. Each shape in the shapefile corresponds to a riding (or, in a few cases, a part of a riding). One thing I have noticed while working with them is that there is no apparent structure to the order in which the shapes appear.
For example, Shape 1 is the boundary of the Vegreville--Wainwright riding in Alberta, while Shape 2 is Bruce--Grey--Owen Sound in Ontario. Since Alberta and Ontario do not even share a border, these two districts are far apart from each other. Meanwhile, the ridings adjacent to Vegreville--Wainwright are numbered 5, 21, 144, 183 195, 217, and 240. Considering there are only 312 shapes [1] in total, 5 and 21 are the only numbers remotely close to 1. If there is any reasoning behind the numbering scheme, it's not easy to tell what it is by looking at the numbers alone. One assumes it's arbitrary.
I use the numbers frequently, so it would be helpful if I could tell a little bit more about how close two ridings are based on their numbers.
The best numbering system would have consecutive numbers mapped to adjacent ridings, so that one riding was adjacent to another if and only if their labels differed by exactly 1. This impossible to do for every riding, however, since it would require each riding to be adjacent to only two other ridings, but most are adjacent to three or more others.
Instead, we could number the ridings so that the numbers of ``close'' ridings are also close.
There are a couple ways we could do this. First, let's put the problem in terms of graph theory. Let $G$ be the graph whose vertices are the electoral districts. Define two vertices to be adjacent if their corresponding districts share a border (excluding the case where two districts share a point). Suppose we label each vertex $v$ with a number $n(v)$ between 1 and the number of vertices, using each number for exactly one vertex.
The fact that the graph bandwidth problem is NP-hard suggests that it will also be difficult to minimize the sum. I also suspect that the sum in the second approach will be of comparable difficulty.
Edit: One way of interpreting the graph bandwidth is not obvious from the name (the name is derived from matrices associated with the graph). If we think of the labels $n(v)$ as locations of vertices along the line from 1 to $|V|$, then $|n(u)-n(v)|$ is the length of the edge. So the graph bandwidth is the smallest possible value for the length of the longest edge. We can say something similar about the first solution. The goal in that case is to minimize the total length of the edges, or, equivalently, the average edge length.
[1] The astute reader will notice that there are 308 ridings in total for the last election, and there will be 338 in the next. So where does this 312 come from? Two ridings include islands that are too far from the mainland to be included in the same shape, so are included as separate shapes, and one riding includes 3 mainland components that are separated from each other by another riding, yielding 4 extra shapes.
For example, Shape 1 is the boundary of the Vegreville--Wainwright riding in Alberta, while Shape 2 is Bruce--Grey--Owen Sound in Ontario. Since Alberta and Ontario do not even share a border, these two districts are far apart from each other. Meanwhile, the ridings adjacent to Vegreville--Wainwright are numbered 5, 21, 144, 183 195, 217, and 240. Considering there are only 312 shapes [1] in total, 5 and 21 are the only numbers remotely close to 1. If there is any reasoning behind the numbering scheme, it's not easy to tell what it is by looking at the numbers alone. One assumes it's arbitrary.
I use the numbers frequently, so it would be helpful if I could tell a little bit more about how close two ridings are based on their numbers.
The best numbering system would have consecutive numbers mapped to adjacent ridings, so that one riding was adjacent to another if and only if their labels differed by exactly 1. This impossible to do for every riding, however, since it would require each riding to be adjacent to only two other ridings, but most are adjacent to three or more others.
Instead, we could number the ridings so that the numbers of ``close'' ridings are also close.
There are a couple ways we could do this. First, let's put the problem in terms of graph theory. Let $G$ be the graph whose vertices are the electoral districts. Define two vertices to be adjacent if their corresponding districts share a border (excluding the case where two districts share a point). Suppose we label each vertex $v$ with a number $n(v)$ between 1 and the number of vertices, using each number for exactly one vertex.
- Ensure adjacent vertices have close numbers. Thus, for each pair of adjacent vertices, compute the difference between their labels, then take the sum of these numbers over all adjacent pairs. That is, compute
$$\sum_{uv\in E}|n(u)-n(v)|$$
Define the best labellings to be those that minimize minimize this sum. - Approximate the the distances between vertices with the difference between their respective labels. To this end, let $d(u,v)$ be the distance between two vertices in the graph and let $D(u,v)=|n(u)-n(v)|$. The difference between the labels approximates the distance between the vertices if $|d(u,v)-D(u,v)|$ is small. Thus, define the best labellings to be those that minimizes the sum
$$\sum_{uv}|d(u,v)-D(u,v)|$$
The fact that the graph bandwidth problem is NP-hard suggests that it will also be difficult to minimize the sum. I also suspect that the sum in the second approach will be of comparable difficulty.
Edit: One way of interpreting the graph bandwidth is not obvious from the name (the name is derived from matrices associated with the graph). If we think of the labels $n(v)$ as locations of vertices along the line from 1 to $|V|$, then $|n(u)-n(v)|$ is the length of the edge. So the graph bandwidth is the smallest possible value for the length of the longest edge. We can say something similar about the first solution. The goal in that case is to minimize the total length of the edges, or, equivalently, the average edge length.
[1] The astute reader will notice that there are 308 ridings in total for the last election, and there will be 338 in the next. So where does this 312 come from? Two ridings include islands that are too far from the mainland to be included in the same shape, so are included as separate shapes, and one riding includes 3 mainland components that are separated from each other by another riding, yielding 4 extra shapes.
Monday, 25 November 2013
Antiderivative vs. Indefinite integral
I spent some time today getting ready for my class for the next term. In particular, I was reading through the sections on antiderivatives and indefinite integrals. I had normally taken these things to be distinct concepts. Given a function $f$, an antiderivative of $f$ is any function whose derivative is $f$. The indefinite integral is the set of all antiderivatives. Since there are infinitely many antiderivatives, while an antiderivative is a single function related to $f$ by differentiation, these are not the same thing.
Or at least, that's what I thought until I read the aforementioned sections. The definitions I read today did not seem to make that distinction. I consulted with the textbook that I used in my own first year calculus class many years ago. This textbook does make the distinction.
I suspect the difference between the two ideas is not appreciated by a lot of students. We don't dwell on it much once we give the definitions. After that, we usually teach them techniques for finding indefinite integrals, and as long as they remember to include the constant of integration, we're happy.
The textbook that doesn't distinguish the two is one of the most widely used introductory calculus texts. It's quite an old version, though. Perhaps newer versions do distinguish.
In any case, it made me wonder how important, if at all, the distinction is. Was a serious error made by leaving it out? Am I being too picky by insisting my students understand the difference?
One thing I do find somewhat bothersome about erasing the distinction is the abuse of notation that results. If $F$ is an antiderivative of $f$, then it can be written
$$\int f(x) dx = F(x)$$
The constant of integration is omitted because there is no distinction between the two terms. This is an abuse of notation, because there are actually infinitely many functions that could appear on the right, all differing form $F$ by a constant. So the $=$ sign doesn't belong there, because it implies uniqueness. Of course, even writing the constant of integration
$$\int f(x) dx = F(x)+C$$
can be seen as an abuse of notation, but at least it captures the idea that there are infinitely many antiderivatives of $f$ and each of them has the form on the right. I suppose, to capture the essence of the idea, we could instead write
$$\int f(x) dx = \{F(x)|F'(x)=f(x)\}=\{G(x)+C|C\in{\mathbb R}\}$$
where $G$ is a known antiderivative of $f$, but I've never seen it written this way.
Monday, 4 November 2013
Expansion Minimization
The determinant of a square matrix $A$ is typically defined in terms of cofactor expansion along the first row of $A$. Then cofactor expansion along other rows or along columns is defined, and shown (or stated) to be equal to the determinant. Following that, there is usually an example of a matrix that contains at least one zero. This example is used to illustrate that sometimes, if we choose the appropriate row or column to expand along (namely, one with zeros), we can reduce work needed to compute the determinant using cofactor expansion.
It is certainly easy to tell which row(s) or column(s) to expand along to minimize the number of cofactors it is necessary to compute at each step. Simply expand along a row or column that has the most zeros.
But what row or column should we expand along to minimize the total number cofactors to compute overall? Or, to put it in more practical terms, what row or column should we expand along to minimize the
amount of writing necessary?
Something to consider is that there are two ways to get a zero in the cofactor expansion. If $B$ is some square submatrix encountered in the cofactor expansion of $A$, then either $b_{ij}=0$ or $\det B_{ij}=0$ ($B_{ij}$ being the $(i,j)-minor of $B$) to make a cofactor. Since determining whether or not $\det B_{ij}=0$ requires a determinant computation, we would probably want to know the answer to the question to answer the question, which leads to circular reasoning. So we'll assume that we're basing our expansion minimization strategy purely on which entries of $A$ are 0.
Of course, the answer to the question posed here is mostly useless for practical purposes, since nobody is going to compute the determinant through cofactor expansion for all but the smallest matrices.
But since we frequently present these example and pose these problems to students, with the expectation that they'll know what the best row or column is to expand along, I wonder if there's actually some way to tell what the best path to the determinant is from the matrix itself.
Subscribe to:
Posts
(
Atom
)